


安装 imwpcache 缓存插件之后网站能提速多少?最详细的评测来了!

很多同学对安装了缓存插件对网站速度能提升多少没什么概念,今天就来给大家评测一下。
用树莓派当服务器测试
先看看硬件情况,主要看cpu信息,如下:
root@raspberrypi:~$ cat /proc/cpuinfo
processor	: 0
model name	: ARMv7 Processor rev 4 (v7l)
BogoMIPS	: 38.40
Features	: half thumb fastmult vfp edsp neon vfpv3 tls vfpv4 idiva idivt vfpd32 lpae evtstrm crc32
CPU implementer	: 0x41
CPU architecture: 7
CPU variant	: 0x0
CPU part	: 0xd03
CPU revision	: 4

processor	: 1
model name	: ARMv7 Processor rev 4 (v7l)
BogoMIPS	: 38.40
Features	: half thumb fastmult vfp edsp neon vfpv3 tls vfpv4 idiva idivt vfpd32 lpae evtstrm crc32
CPU implementer	: 0x41
CPU architecture: 7
CPU variant	: 0x0
CPU part	: 0xd03
CPU revision	: 4

processor	: 2
model name	: ARMv7 Processor rev 4 (v7l)
BogoMIPS	: 38.40
Features	: half thumb fastmult vfp edsp neon vfpv3 tls vfpv4 idiva idivt vfpd32 lpae evtstrm crc32
CPU implementer	: 0x41
CPU architecture: 7
CPU variant	: 0x0
CPU part	: 0xd03
CPU revision	: 4

processor	: 3
model name	: ARMv7 Processor rev 4 (v7l)
BogoMIPS	: 38.40
Features	: half thumb fastmult vfp edsp neon vfpv3 tls vfpv4 idiva idivt vfpd32 lpae evtstrm crc32
CPU implementer	: 0x41
CPU architecture: 7
CPU variant	: 0x0
CPU part	: 0xd03
CPU revision	: 4

Hardware	: BCM2709
Revision	: a02082
Serial		: 000000002ba83af3
很多年前的树莓派了,ARMv7 4核心,900MHZ主频。跑wordpress可以说比较吃力,但打开还是没问题的。
PHP信息
如下,已经安装了opcache。
root@raspberrypi:~$ php -v
PHP 7.1.4 (cli) (built: Apr 14 2017 14:03:18) ( NTS )
Copyright (c) 1997-2017 The PHP Group
Zend Engine v3.1.0, Copyright (c) 1998-2017 Zend Technologies
    with Zend OPcache v7.1.4, Copyright (c) 1999-2017, by Zend Technologies
未安装缓存时表现
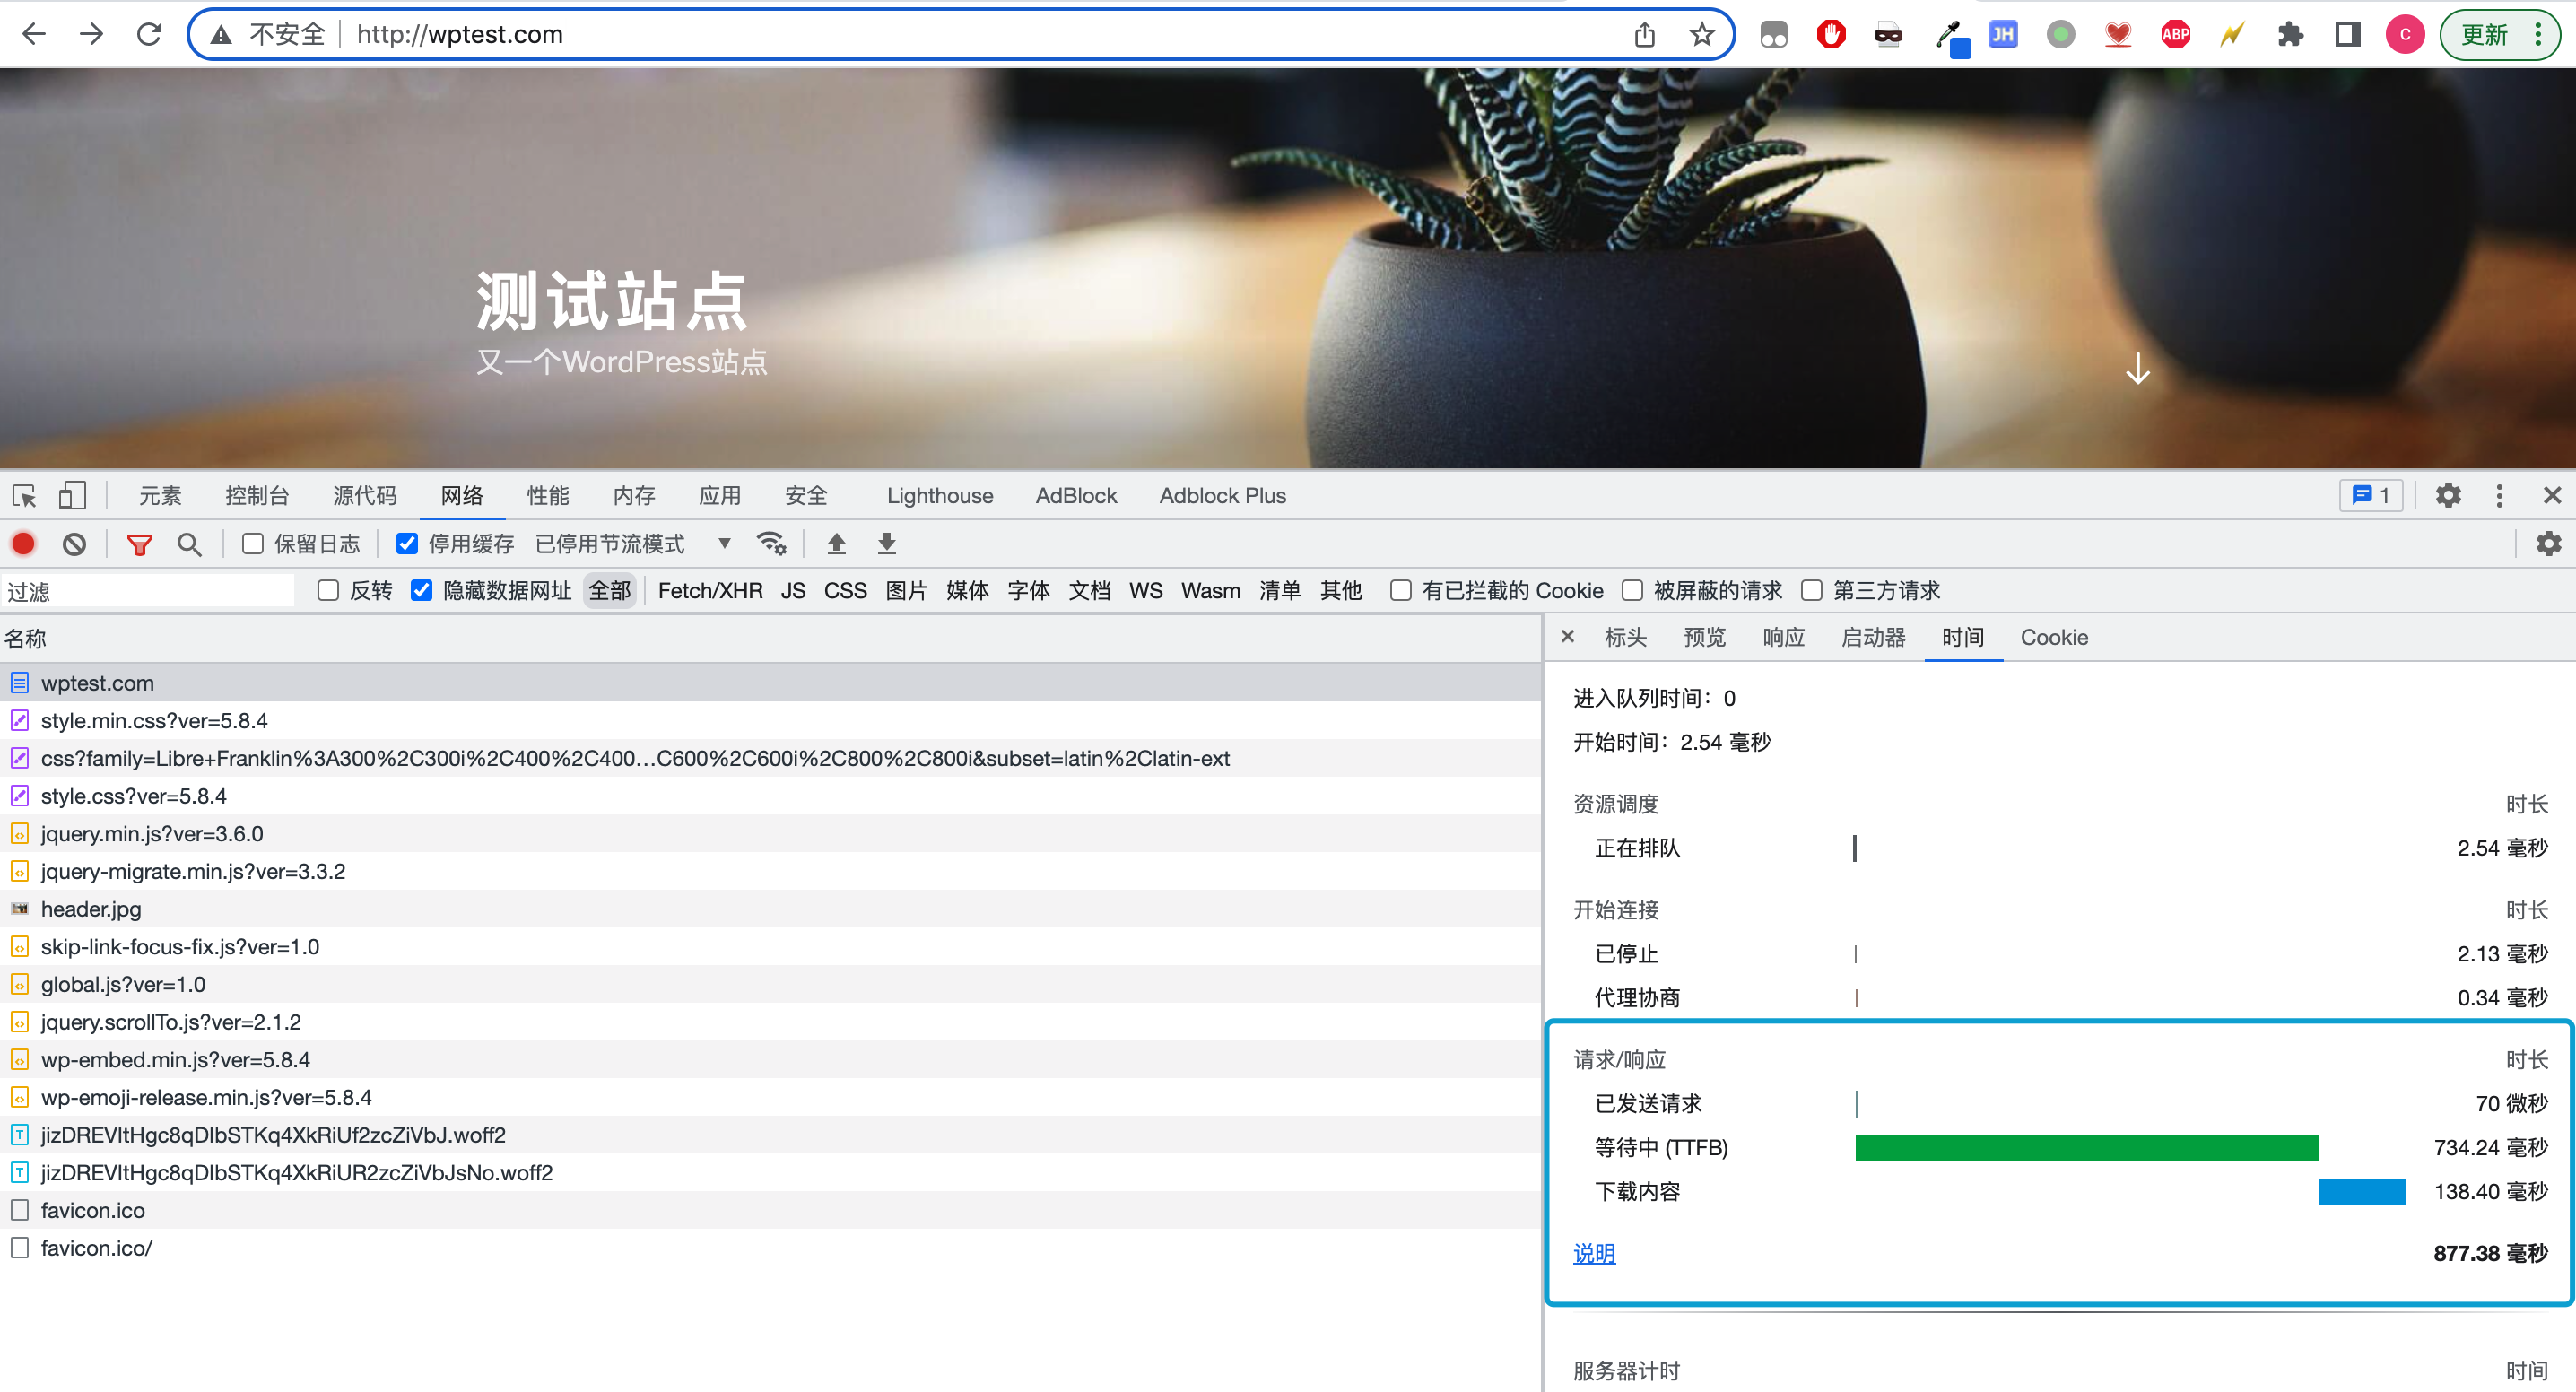
没有使用缓存的情况下,首页打开速度是800ms左右,如下图:
现在我们用ab工具看看这个环境能抗多少并发。
测试一、并发数2总共10个请求,测试结果如下:
Connection Times (ms)
              min  mean[+/-sd] median   max
Connect:        1    4   3.0      3      11
Processing:   878  899  16.0    901     935
Waiting:      260  264   3.4    264     271
Total:        881  903  15.6    905     938

Percentage of the requests served within a certain time (ms)
  50%    905
  66%    905
  75%    908
  80%    910
  90%    938
  95%    938
  98%    938
  99%    938
 100%    938 (longest request)
和单次请求基本一样,接下来加大并发数。
测试二、并发5个请求,总共50个请求,测试结果如下:
Connection Times (ms)
              min  mean[+/-sd] median   max
Connect:        2    5   3.9      3      27
Processing:   906 1166 219.1   1122    2101
Waiting:      268  419 163.0    359    1029
Total:        909 1171 219.5   1127    2104

Percentage of the requests served within a certain time (ms)
  50%   1127
  66%   1182
  75%   1226
  80%   1264
  90%   1438
  95%   1677
  98%   2104
  99%   2104
 100%   2104 (longest request)
访问时间基本超过1s,5个并发的时候99分位耗时是2s。
测试三、并发数10总共200个请求,测试结果如下:
Connection Times (ms)
              min  mean[+/-sd] median   max
Connect:        2    4   4.2      3      32
Processing:   881 2301 286.5   2308    3117
Waiting:      307 1511 232.5   1502    2233
Total:        884 2306 286.5   2311    3120

Percentage of the requests served within a certain time (ms)
  50%   2311
  66%   2410
  75%   2462
  80%   2499
  90%   2616
  95%   2737
  98%   2900
  99%   2955
 100%   3120 (longest request)
10个并发的时候99分位的请求耗时接近3s,这个速度基本不能接受了。
10个并发是什么概念呢?如果全天都是均匀的10个并发,那网站每天的流量就是864000,也就是84w。考虑到夜间没什么流量,打个折基本是40w。大部分网站都达不到这个访问量。
安装缓存后表现
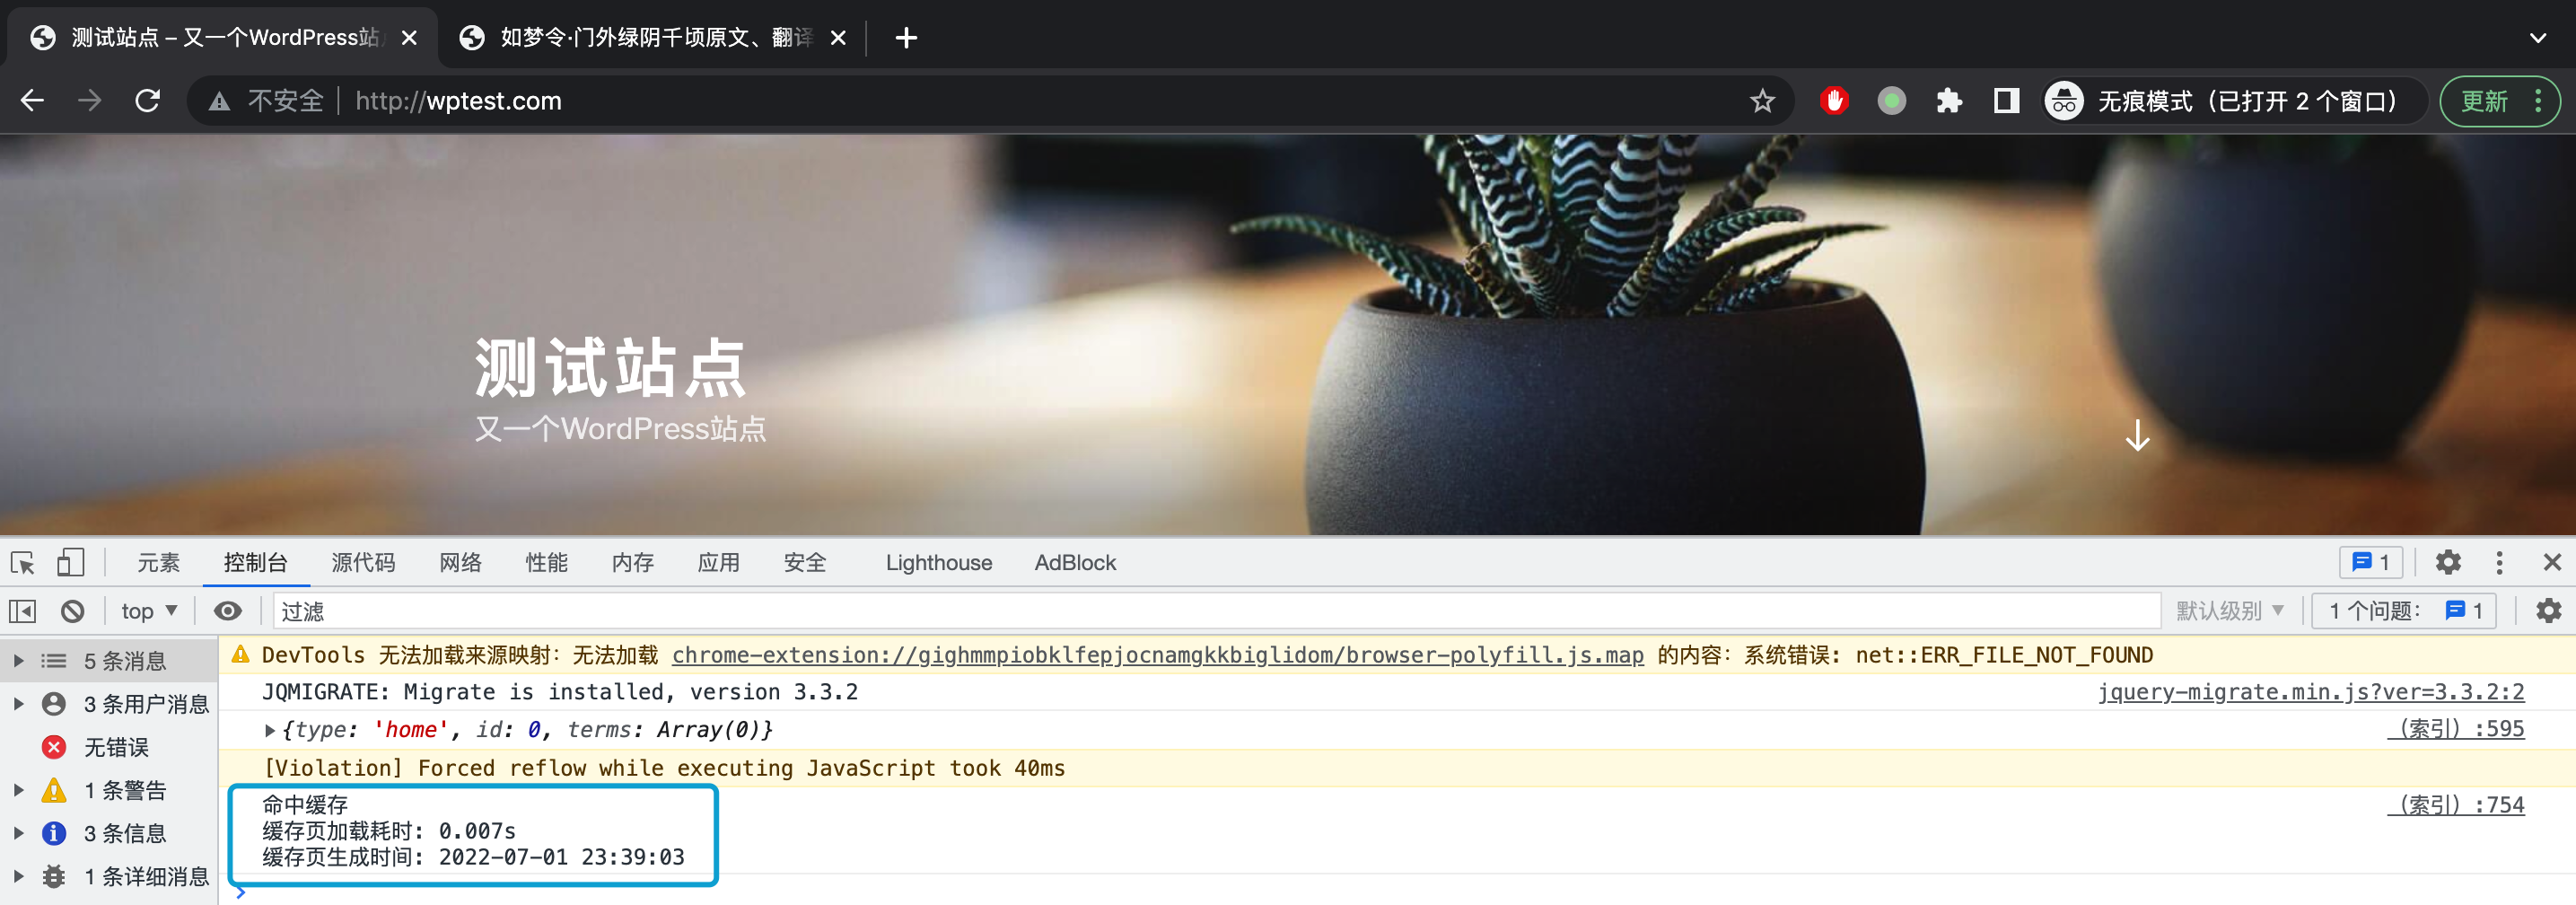
先用chrome打开看看,直接到56ms。
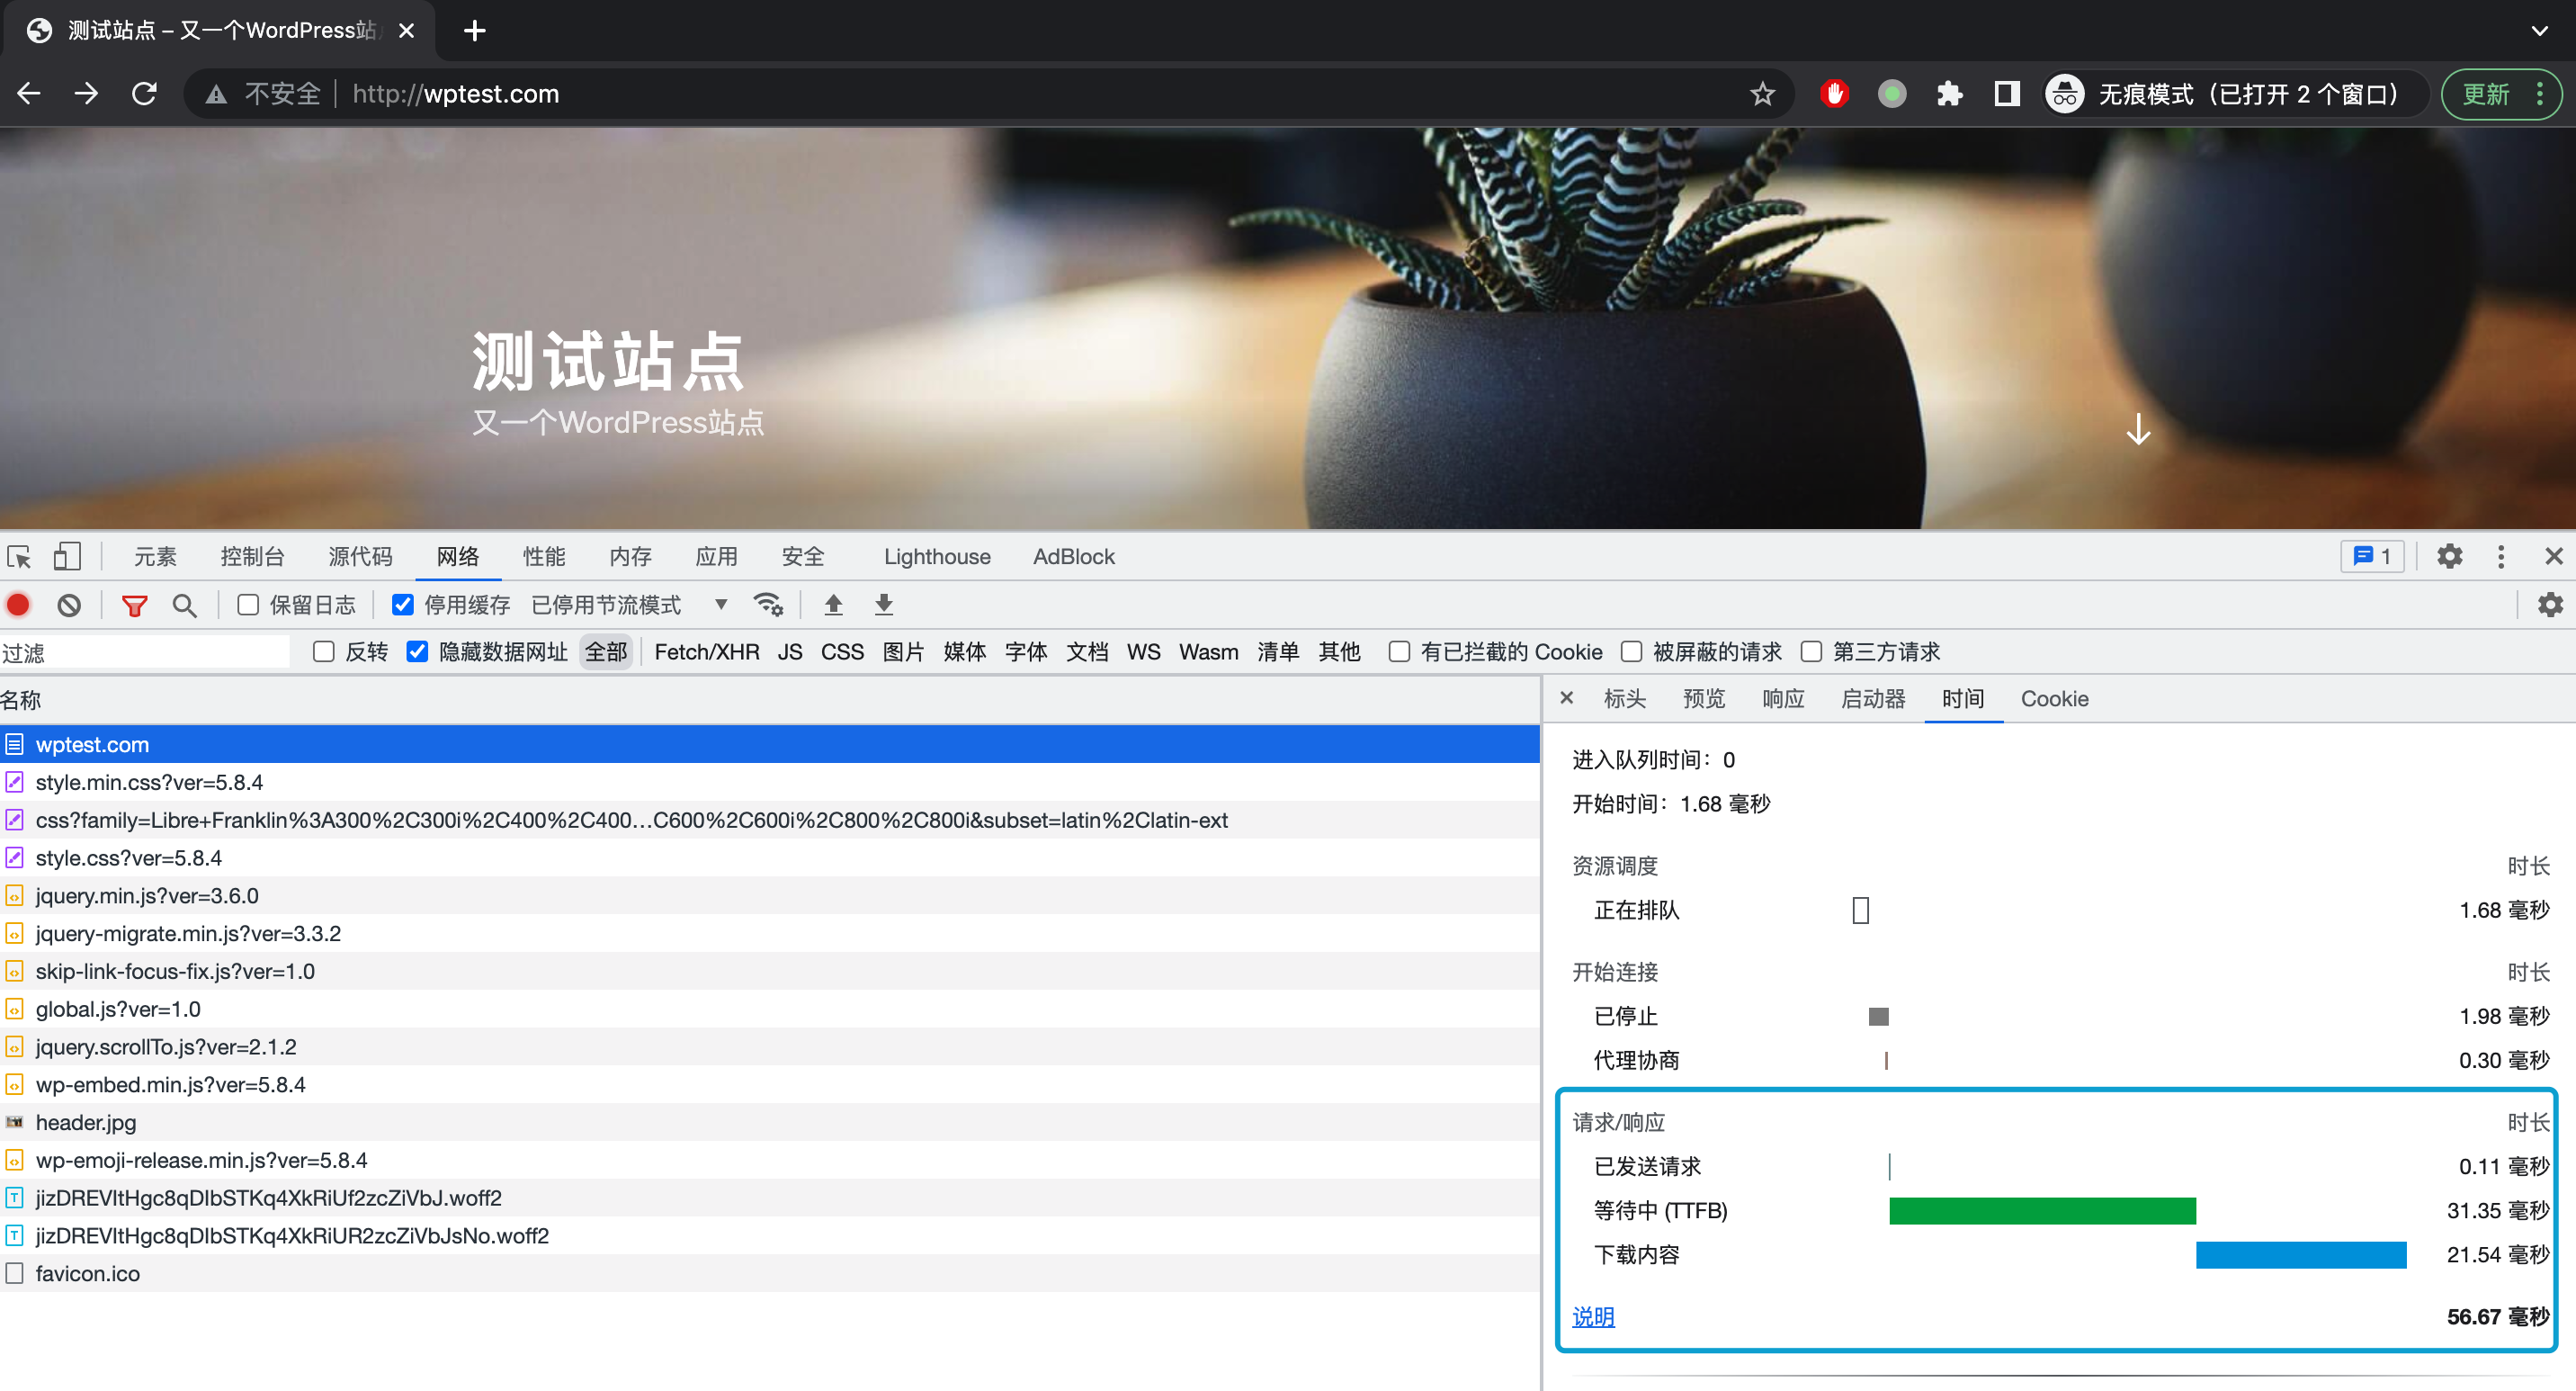
当前页面是命中缓存的状态。好家伙,打开速度从877ms下降到56ms,速度提升1400%。
再用ab测试一下看看。
这次并发数就不逐渐往上提了,我们直接上5个并发,100个请求试试。
Connection Times (ms)
              min  mean[+/-sd] median   max
Connect:        2   13   8.3     11      53
Processing:    58  115  37.2    109     253
Waiting:       16   32  10.9     30      93
Total:         73  128  39.0    119     265

Percentage of the requests served within a certain time (ms)
  50%    119
  66%    135
  75%    144
  80%    147
  90%    170
  95%    226
  98%    261
  99%    265
 100%    265 (longest request)
99分位耗时是265ms。相比原先的2104ms速度也提升了690%。
加大到10个并发试试。
Connection Times (ms)
              min  mean[+/-sd] median   max
Connect:        2   17  12.3     14      75
Processing:    68  161  34.1    162     255
Waiting:       19   45  16.9     42     116
Total:         82  179  33.9    181     274

Percentage of the requests served within a certain time (ms)
  50%    181
  66%    195
  75%    201
  80%    206
  90%    220
  95%    231
  98%    260
  99%    262
 100%    274 (longest request)
看起来和5个并发差不多,速度并没有下降多少。
20个并发结果,99分位耗时605ms。
Connection Times (ms)
              min  mean[+/-sd] median   max
Connect:        3   30  17.9     27     107
Processing:    67  395  89.7    390     578
Waiting:       14   68  27.3     62     176
Total:         73  425  95.4    421     623

Percentage of the requests served within a certain time (ms)
  50%    421
  66%    457
  75%    491
  80%    517
  90%    561
  95%    584
  98%    601
  99%    605
 100%    623 (longest request)
继续加大到50并发
Connection Times (ms)
              min  mean[+/-sd] median   max
Connect:        5   61  50.8     57     437
Processing:    95  821 213.7    776    1813
Waiting:       22  117  62.1     99     482
Total:        103  881 221.8    842    1889

Percentage of the requests served within a certain time (ms)
  50%    842
  66%    928
  75%    984
  80%   1042
  90%   1159
  95%   1310
  98%   1447
  99%   1548
 100%   1889 (longest request)
99分位耗时在1548ms,再往上提并发已经意义不大了。
安装了缓存的树莓派基本可以作为一个小型服务器对外提供服务了,每天10w pv基本无压力。
普通VPS测试
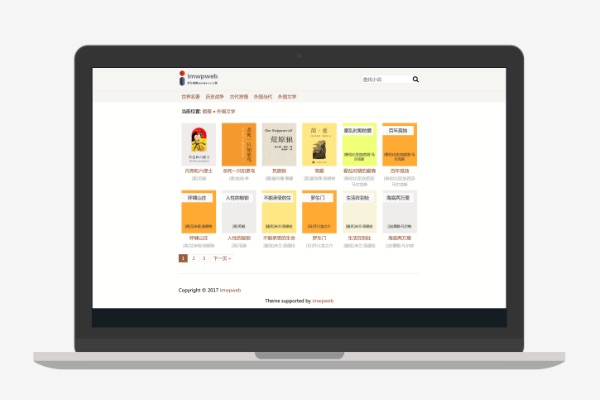
接下来我们测试一下一个普通的vps安装缓存之后能抗多少流量。直接拿我的一个测站来压一下,我们直接在服务器测试,这样可以忽略网络带来的延迟。
下面是我的一个服务器信息:
[root@VM-0-13-centos ~]# cat /proc/cpuinfo
processor	: 0
vendor_id	: GenuineIntel
cpu family	: 6
model		: 79
model name	: Intel(R) Xeon(R) CPU E5-26xx v4
stepping	: 1
microcode	: 0x1
cpu MHz		: 2394.446
cache size	: 4096 KB
physical id	: 0
siblings	: 1
core id		: 0
cpu cores	: 1
apicid		: 0
initial apicid	: 0
fpu		: yes
fpu_exception	: yes
cpuid level	: 13
wp		: yes
flags		: fpu vme de pse tsc msr pae mce cx8 apic sep mtrr pge mca cmov pat pse36 clflush mmx fxsr sse sse2 ss ht syscall nx lm constant_tsc rep_good nopl eagerfpu pni pclmulqdq ssse3 fma cx16 pcid sse4_1 sse4_2 x2apic movbe popcnt tsc_deadline_timer aes xsave avx f16c rdrand hypervisor lahf_lm abm 3dnowprefetch bmi1 avx2 bmi2 rdseed adx xsaveopt
bogomips	: 4788.89
clflush size	: 64
cache_alignment	: 64
address sizes	: 40 bits physical, 48 bits virtual
power management:
是个单核服务器,主频为2394MHZ,一个非常小型的vps。
测试一、1个并发,总共10个请求
[root@VM-0-13-centos ~]# ab -c1 -n10 https://www.xuexiezuowen.com/
This is ApacheBench, Version 2.3 <$Revision: 1430300 $>
Copyright 1996 Adam Twiss, Zeus Technology Ltd, http://www.zeustech.net/
Licensed to The Apache Software Foundation, http://www.apache.org/

Benchmarking www.xuexiezuowen.com (be patient).....done


Server Software:        nginx
Server Hostname:        www.xuexiezuowen.com
Server Port:            443
SSL/TLS Protocol:       TLSv1.2,ECDHE-RSA-AES128-GCM-SHA256,2048,128

Document Path:          /
Document Length:        33348 bytes

Concurrency Level:      1
Time taken for tests:   0.069 seconds
Complete requests:      10
Failed requests:        0
Write errors:           0
Total transferred:      335460 bytes
HTML transferred:       333480 bytes
Requests per second:    145.16 [#/sec] (mean)
Time per request:       6.889 [ms] (mean)
Time per request:       6.889 [ms] (mean, across all concurrent requests)
Transfer rate:          4755.37 [Kbytes/sec] received

Connection Times (ms)
              min  mean[+/-sd] median   max
Connect:        3    3   0.3      3       4
Processing:     4    4   0.4      4       5
Waiting:        3    4   0.4      4       4
Total:          6    7   0.5      7       8

Percentage of the requests served within a certain time (ms)
  50%      7
  66%      7
  75%      7
  80%      7
  90%      8
  95%      8
  98%      8
  99%      8
 100%      8 (longest request)
测试二、10个并发,100请求
Connection Times (ms)
              min  mean[+/-sd] median   max
Connect:        4   23   4.9     22      46
Processing:     6   28   4.8     29      44
Waiting:        4   27   4.5     28      38
Total:         10   51   5.8     52      74

Percentage of the requests served within a certain time (ms)
  50%     52
  66%     52
  75%     53
  80%     53
  90%     54
  95%     55
  98%     70
  99%     74
 100%     74 (longest request)
99分位耗时74ms,均值时51ms,相当给力。
测试三、20个并发,200个请求
Connection Times (ms)
              min  mean[+/-sd] median   max
Connect:        3   45  22.2     44     218
Processing:     4   88 112.4     60     660
Waiting:        4   62  73.2     49     660
Total:          8  133 115.2    110     702

Percentage of the requests served within a certain time (ms)
  50%    110
  66%    113
  75%    114
  80%    118
  90%    234
  95%    435
  98%    686
  99%    693
 100%    702 (longest request)
99分位耗时为693ms,均值时133ms,速度能接受。
测试四、50个并发、500个请求
Connection Times (ms)
              min  mean[+/-sd] median   max
Connect:        3   89 100.6     84     810
Processing:     4  369 328.7    232    2270
Waiting:        4  221 240.5    206    2037
Total:          9  458 347.6    334    2504

Percentage of the requests served within a certain time (ms)
  50%    334
  66%    437
  75%    499
  80%    640
  90%    871
  95%   1218
  98%   1707
  99%   1848
 100%   2504 (longest request)
99分位耗时1.8s,均值是458ms,再往上加并发就没什么意义了。
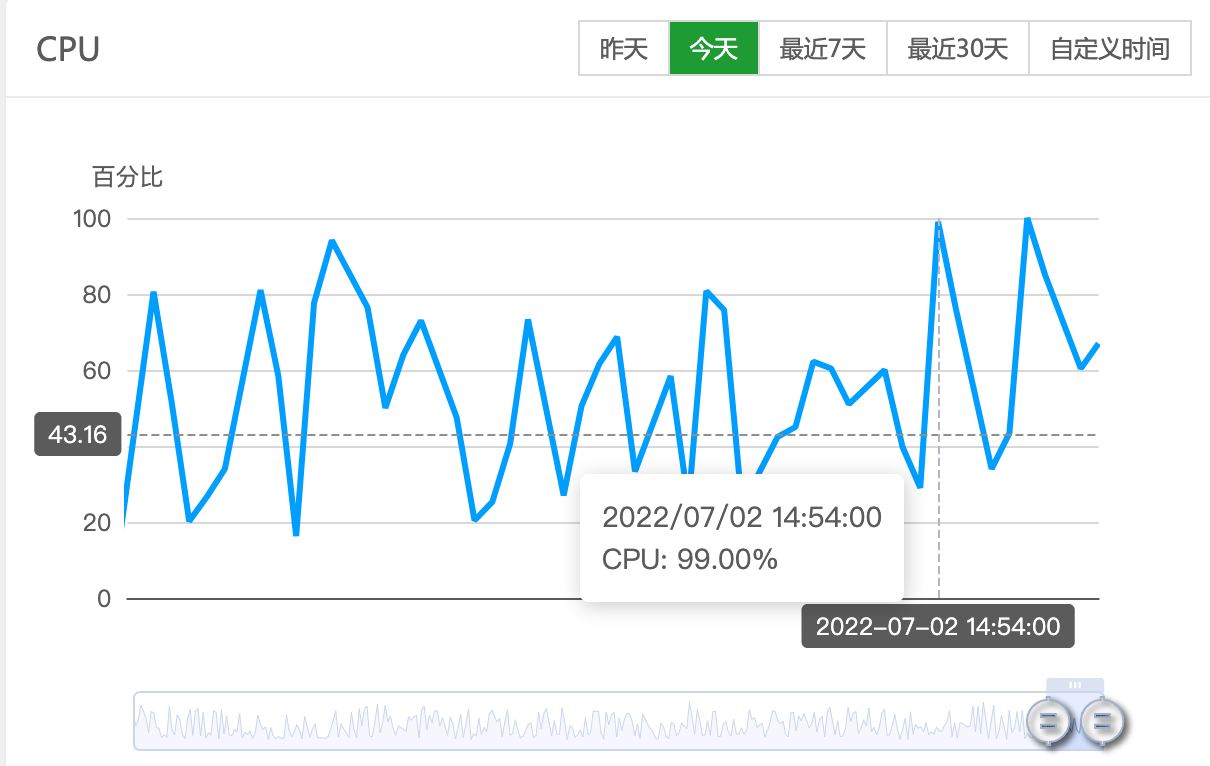
测试时cpu基本被打满了,如下:
总结
根据树莓派的测试结果来看,安装缓存最高速度大约能提升14倍。随着流量的增加,缓存带来的收益会越来越明显。流量越高,提升越明显。
一个单核vps的wordpress安装imwpcache缓存插件,并发不超过10的时候,页面打开速度在50-100ms左右。也就是说一个普通vps每天能抗的流量大概在40w左右。考虑到一个页面打开时可能还会访问其他的静态资源,ajax加载的一些东西,保守估计一天20w pv应该非常轻松。
你可能还喜欢下面这些文章
 WordPress 缓存插件 imwpcache 最快的全站静态化插件
imwpcache是一款可最大限度提升网站访问速度的WordPress插件,通过多缓存引擎支持如SQLite、Memcache和Redis等,实现页面加载速度由秒级到毫秒级的提升。该插件提供全站缓存、缓存管理、缓存功能等,适用于多种类型的网站
 WordPress 缓存插件 imwpcache 常见问题解答
memcache缓存驱动将缓存存储在memcache服务上,缓存的读写和memcache服务交互。redis缓存驱动将缓存存储在redis服务上,缓存的读写和redis服务交互。
 wordpress用哪种缓存插件,哪种缓存插件比较好
Cache是我们推荐的最后一款插件,这是一款可以立即使用的插件,作者已经把插件的默认设置调到最优,用户安装好以后只需要开启、保存,即可全面提速网站,插件提供了包括页面缓存、浏览器缓存、Gzip压缩、404页面缓存等多种功能,也是一个不错的选择
 判断页面是否已缓存的 2 个方法
用imwpcache缓存插件时,有时候觉得打开一个页面慢,因此不确定这个页面是否已经缓存。这篇文章就教大家判断一个页面是否缓存。同时这里还可以清除缓存方法二:查看源码标记首先使用浏览器的无痕模式(隐身模式)打开你需要检测是否缓存的页面。
 为什么WordPress插件安装后不生效
WordPress插件安装后不生效是常见问题,可能由多种原因导致。首先确认插件是否已激活,这是最易被忽视的步骤。若已激活仍无效,需排查插件冲突——停用其他插件并切换默认主题测试。缓存问题(浏览器、服务器或CDN)也常导致插件"隐形",建议强制
 网站卡成狗,原因竟然是没安装opcache
启用opcache,登陆状态下(不用全站缓存)打开首页331ms。停用opcache,打开首页(不用全站缓存)。一、opcache扩展二、imwpcache全站静态缓存插件。
 如何解决WordPress网站CDN加速失效的问题
**摘要内容:** 当WordPress网站配置CDN后仍出现加载缓慢或资源失效时,可能是基础配置、缓存规则或混合内容问题导致。首先检查CDN域名解析是否正确(如Cloudflare需开启代理状态),确保静态资源URL替换为CDN地址。其次
 WordPress 加速引擎,一款真正从底层加速 WordPress的插件
加速原理市面上面常规的后台加速插件大概分为两类:合并压缩或者替换js、css等静态资源达到加速页面加载的目的缓存后台数据库查询达到加速的目的其中第一类基本没什么用,文章数量少的时候不需要加速,文章数量一多不会有任何加速效果。